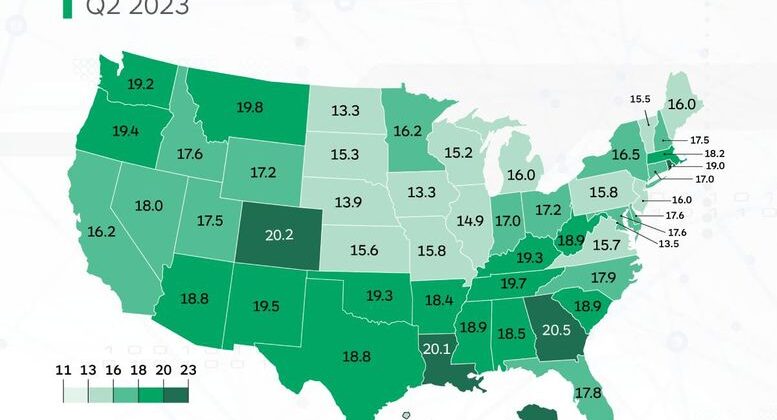
Alaska recorded the highest overall LOR in Q2 at 22.7 days, followed by Georgia (20.5), Colorado (20.2) and Louisiana (20.1). Hawaii had the lowest LOR with 13.1 days. North Dakota and Iowa were next-lowest at 13.3 days each, with DC (13.5) and Nebraska (13.9) completing the states under 14 days.
Graphic: Enterprise Rent-A-Car
The Q2 2023 U.S. Length of Rental (LOR) results (17.4 days) show the first dip in LOR year-over-year since the first stages of the pandemic, according to figures released recently by Enterprise Rent-A-Car.
While positive, these results continue to reflect the new normal, as LOR for Q2 2021 was 13.2 days. Length of Rental is defined as replacement rental vehicles that are in the shop for repairs. Data gathered by Enterprise’s automated rental management system (ARMS) tracks the length of time a replacement vehicle is rented to collision center customers and is considered a proxy for vehicle repair time.
The report concludes: As the numbers show, the trend of ‘predictable’ seasonal LOR continues. The LOR decrease is positive, and many repairers are finding ways to anticipate and operate in the new normal. However, challenging market conditions remain, and overall LOR remains significantly higher than it was pre-pandemic.
Alaska recorded the highest overall LOR in Q2 at 22.7 days, followed by Georgia (20.5), Colorado (20.2) and Louisiana (20.1). Hawaii had the lowest LOR with 13.1 days. North Dakota and Iowa were next-lowest at 13.3 days each, with DC (13.5) and Nebraska (13.9) completing the states under 14 days.
“We’re seeing several trends that could account for some – though not a lot – of decline in LOR, at least for now,” said John Yoswick, editor of the weekly CRASH Network newsletter, in the report. “Shops’ backlog of work tends to drop in the spring, and this year was no exception. The national average backlog was 4.7 weeks in Q2 2023, down from 5.8 weeks the prior quarter. Before the pandemic, the typical second quarter decline in backlog was about three days.”
In the Enterprise report, Yoswick also noted: This year, the drop was almost eight days, and the percentage of shops that could schedule a job in two weeks or less increased 14 percentage points to 27%. While that is the highest percentage of shops with a ‘normal’ backlog since October 2021, it is still far from the pre-pandemic second quarter average of 72%.
Nearly half of all shops (46%) were still scheduling work four or more weeks into the future. That is a significant decline from 60% in the first quarter of this year, but also far from the typical 7% with that length of backlog pre-pandemic.
Non-Drivable Vehicles
LOR for non-drivable claims was 25.6, a 0.8-day decrease from Q2 2022.
Montana had the highest LOR at 36.0 days, a 3.1-day increase. Next highest was Alaska (35.4), followed by Colorado (32.2). All told, eight states had non-drivable LOR greater than 30 days, with six more states at 28 days or higher.
Oregon (31.5) had the highest increase at 3.3 days. Positively, only 13 states had non-drivable LOR increases, while 37 states plus DC had decreases. Compare this to Q2 2022, when every single state and DC had an increase of at least 1.2 days.
Drivable Vehicles
For rentals associated with drivable repairs, LOR in Q2 2023 was 15.5 days, a 0.3-day increase.
Alaska also had the highest drivable LOR in Q2 2023 at 18.8 days. Georgia (18.6), Tennessee (17.8) and Louisiana (17.7) were the next-highest.
Total Loss Vehicles
For rentals associated with total loss claims, LOR was 16.5 days, a 0.8-day decrease over Q2 2022.
While Alaska had the highest results at 25.3 days (+5.1 days), the next highest was Kentucky at 20.3 days, followed by Montana at 20 days.
Source: Read Full Article

