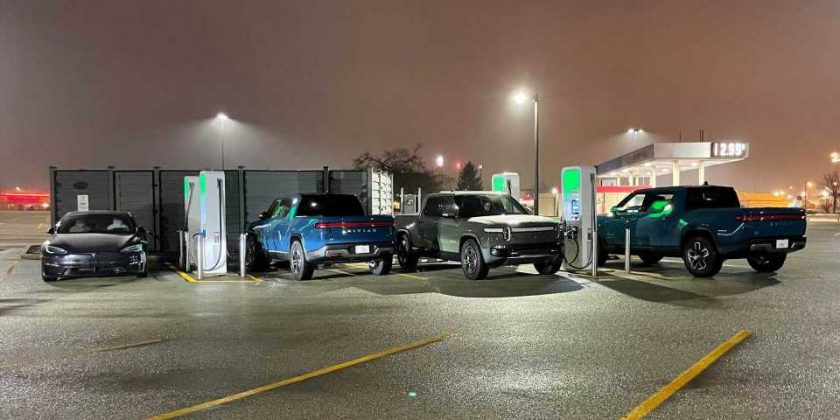
Yesterday we reported about an interesting one-off/DIY charging adapter – from CCS Combo 1 (CCS1) to Tesla’s proprietary standard – that allows charging a Tesla Model S Plaid at CCS1 chargers.
The project, developed by Ryan Huber, was successfully tested at Electrify America stations, but it is not a commercial product. We don’t know whether Tesla’s factory/non-modified adapter (that is coming “soon”) will offer similar results, but it’s worth checking out what is possible.
According to the report and the chart shared by Ryan Huber with InsideEVs, the power output might exceed 200 kW. Let’s compare it with a Tesla Model S charging at a V3 Supercharger (250 kW) and see the differences.
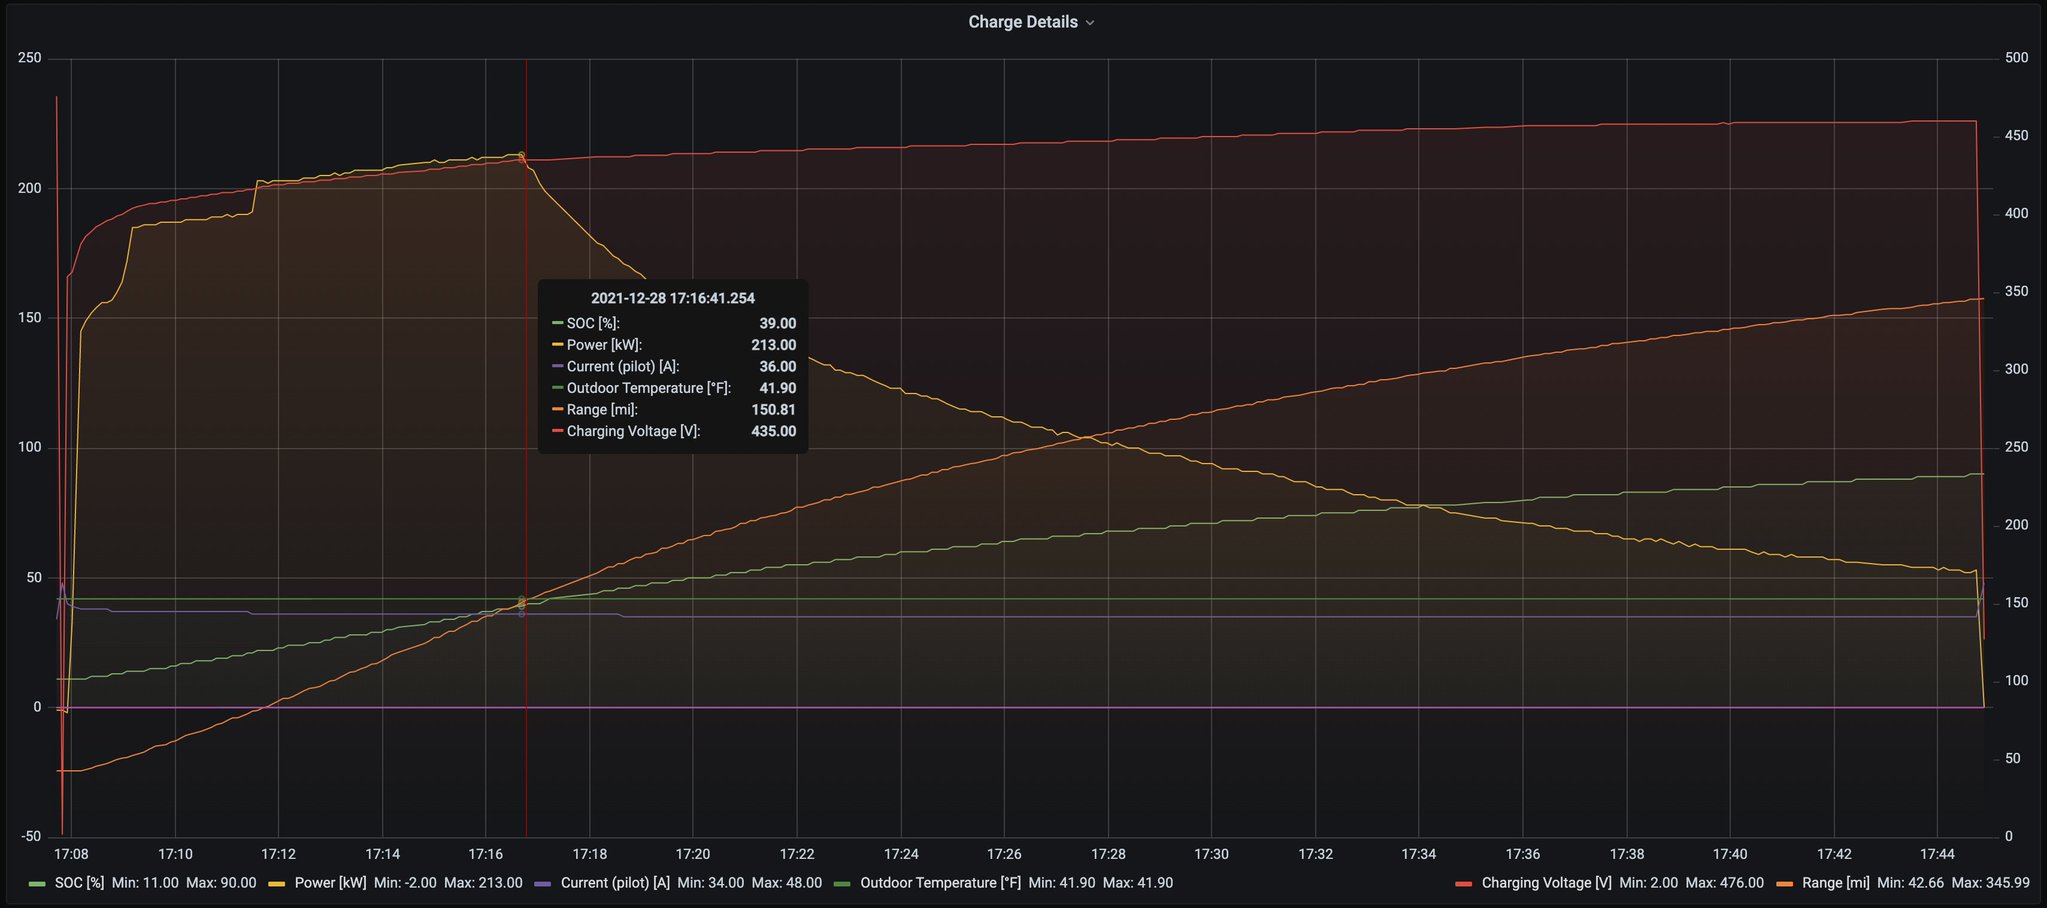
The charging curve at CCS1 chargers (enlarge here):
For the purposes of this analysis, we collected the data, but please note that the uncertainty of measurement/calculation is at least a few percentspercent
Charging power vs state-of-charge (SOC)
The particular session started at around 10-11% state-of-charge (SOC). The power quickly increased to over 150 kW at 13% SOC and over 180 kW at 15% SOC and then continued to increase gradually to a peak of over 213 kW around 39% SOC.
From 40% SOC, the power output was decreasing smoothly, and typically for Tesla cars, down to just over 50 kW at 90% SOC.
State-of-charge (SOC) vs time
The charging session from 11-90% took roughly 36 minutes. Other times are:
- 11-80%: 27 minutes
- 20-80%: 24 minutes
- 11-90%: 36 minutes
- 20-90%: 33 minutes
Charging from 20% to 80% SOC took about 24 minutes. Pretty good results, we must admit.
Average charging power vs state-of-charge (SOC)
The average power in the very important range from 20% to 80% SOC is 140 kW, which is 66% of the peak value.
C-rate vs state-of-charge (SOC)
The peak C-rate* – charging power in relation to the total battery capacity of 100 kWh (rough estimation) – is about 2.1C.
The average C-rate when charging from 20% to 80% SOC is 1.4C.
*C-rate tells us how the charging power relates to the battery pack capacity. For example: 1C is 1-hour charging power (current), when the power value in kW is equal to the battery pack capacity in kWh. 2C would be enough to recharge in half an hour.
The net battery capacity of 95 kWh (rough estimation) is about 95% of the total battery capacity.
Range replenishing speed vs state-of-charge (SOC)
The rate of range replenishing depends on the energy consumption and the energy consumption depends on the use case.
In this article, we will use Tesla Model S Plaid range numbers for the 21″ wheel version of the car (the 19″ wheel version has a higher range).
- WLTP
Taking into consideration the WLTP range of 628 km (390 miles) and available battery capacity of 95 kWh, we can assume energy consumption of 151 Wh/km (243 Wh/mile).
The effective average speed of range replenishing when charging from 20% to 80% SOC would be then 15.5 km/minute (9.6 miles/minute). - EPA Combined range
Taking into consideration the EPA Combined range of 348 miles (560 km) and available battery capacity of 95 kWh, we can assume energy consumption of 273 Wh/mile (170 Wh/km).
The effective average speed of range replenishing when charging from 20% to 80% SOC would be then 8.6 miles/minute (13.8 km/minute). - EPA Highway range
Taking into consideration the EPA Highway range of 341 miles (549 km) and available battery capacity of 95 kWh, we can assume energy consumption of 279 Wh/mile (173 Wh/km).
The effective average speed of range replenishing when charging from 20% to 80% SOC would be then 8.4 miles/minute (13.5 km/minute). - IEVs 70 mph range test
Taking into consideration the IEVs 70 mph range test result of 300 miles (483 km) and available battery capacity of 95 kWh, we can assume energy consumption of 317 Wh/mile (197 Wh/km).
The effective average speed of range replenishing when charging from 20% to 80% SOC would be then 7.4 miles/minute (11.9 km/minute).
Assuming the IEVs 70 mph range test result, the average speed of range replenishing for 20-80% SOC window would be 7.4 miles/minute (11.9 km/minute).
Ultimate DC fast charging card
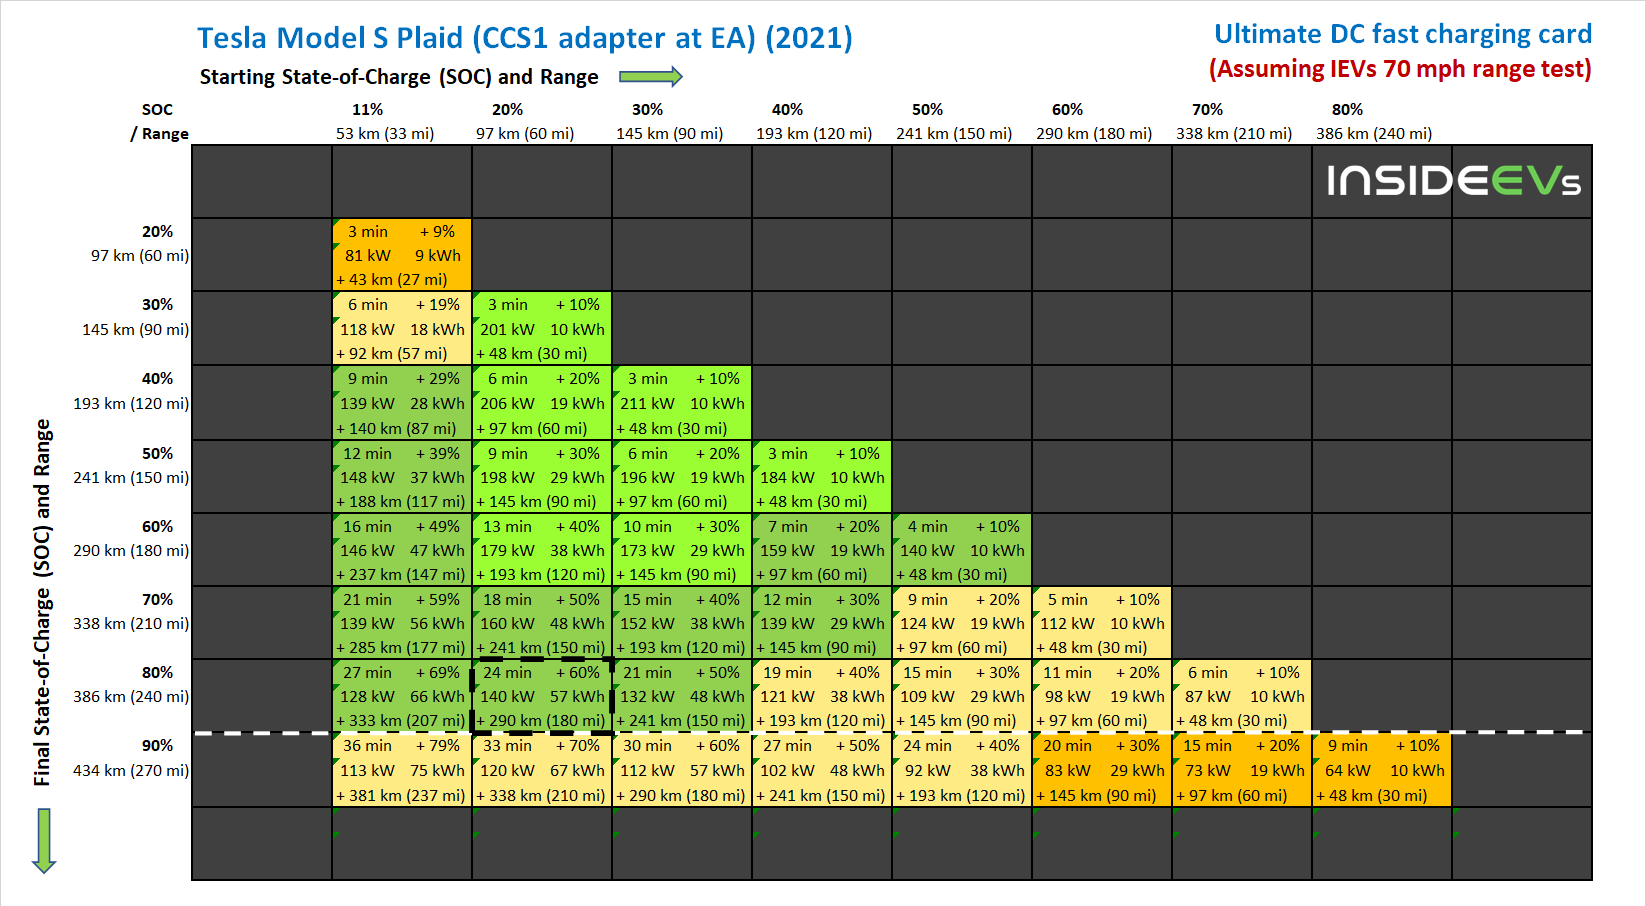
Here is our ultimate charging card for the Tesla Model S Plaid (CCS1 adapter at EA) that shows the estimated time of charging to add a certain number of SOC percent points, average charging power, added energy and added range for listed SOC ranges. Click here to enlarge the image.
The matrix above, might be helpful from the user perspective, but be aware that it’s just an estimate from a particular test, with measure and calculation uncertainty probably above 5%. On top of that comes variation for individual case – car (version, age/battery state-of-health), charger, ambient and battery temperature, software version and more (including cabin heating/cooling during charging). Another thing is that the charging curve might shift when charging starts at a lower/higher SOC.
Comparisons with other EVs
Now it’s time to compare the CCS1 charging with the Tesla Model S Plaid Supercharging:
- Tesla Model S Plaid 21″ CCS1 adapter at EA
- Tesla Model S Plaid 21″ V3 Supercharging – Tom Moloughney’s test (October 2021), analyzed here
at 80% SOC, the session was interrupted and required a quick re-connection (see the bump on the black line), but it has a marginal influence on the result
Comparison of charging power
If we compare the raw charging sessions, we can see that most of the charging curve is very similar – between about 40% to over 90% SOC (and probably up to 100%, but the chart ends).
On the other hand, in the first part of Tom’s V3 Supercharging session, the car is able to charge at up to 250 kW. The car with the CCS1 adapter (started at around 11% SOC) reached a maximum of over 213 kW.
We guess that 200+ kW is the max for Tesla-CCS charging. A similar result (shape and power levels) was noted in Europe while using a CCS2 charger, but in the case of a Tesla Model 3 Long Range (natively).
Interesting are the results in the popular 20-80% SOC window, the car with the CCS1 adapter noted an average of 140 kW, compared to 139 kW in the case of the V3 SC Supercharger.
That is because Tom’s session started right at 0% SOC and got up to 250 kW quickly. Charging constraints (battery temperature or voltage) required lower the output after about a third of the session. The CCS1 was a bit higher for most of the time then (usually by several kW).
In the case of the 11-90% SOC window, the CCS is at 128 kW, while the V3 Supercharging (10-80% SOC) was at 149 kW. A small difference.
| DC Fast Charging Comparison by InsideEVs | ||||
| Model [data source] | Drive / Battery (kWh) | Max Power | Avg Power (10-80%) | Avg Power (20-80%) |
| 2021 Tesla Tesla Model S Plaid (CCS1 adapter at EA) [Ryan Huber] | AWD 100 kWh | 213 kW | 128 kW | 140 kW |
| 2021 Tesla Model S Plaid 21″ (V3 SC) [Tom Moloughney] | AWD 100 kWh | 250 kW | 149 kW | 139 kW |
Comparison of State-of-charge (SOC) vs time
The difference in the charging time is very small – noticeable only in the beginning:
*The starting points were adjusted to the lowest common SOC.
Here are the numbers:
| DC Fast Charging Comparison by InsideEVs | |||||
| Model [data source] | Drive / Battery (kWh) | Time (10-80%) | Time (20-80%) | Time (10-90%) | Time (20-90%) |
| 2021 Tesla Tesla Model S Plaid (CCS1 adapter at EA) [Ryan Huber] | AWD 100 kWh | 27 min | 24 min | 36 min | 33 min |
| 2021 Tesla Model S Plaid 21″ (V3 SC) [Tom Moloughney] | AWD 100 kWh | 27 min | 25 min | 37 min | 34 min |
Comparison of C-rate
C-rate comparison is a natural consequence of the charging power (both batteries are the same):
A bit of summary:
| DC Fast Charging Comparison by InsideEVs | |||||
| Model [data source] | Drive / Battery (kWh) | Max Power | Avg Power (20-80%) | Max C-Rate | Avg C-Rate (20-80%) |
| 2021 Tesla Tesla Model S Plaid (CCS1 adapter at EA) [Ryan Huber] | AWD 100 kWh | 213 kW | 140 kW | 2.1 | 1.4 |
| 2021 Tesla Model S Plaid 21″ (V3 SC) [Tom Moloughney] | AWD 100 kWh | 250 kW | 139 kW | 2.5 | 1.4 |
Comparison of range replenishing speed
Excluding the initial period, when Tesla can enjoy the full 250 kW of V3 Supercharging, the range replenishing rate will be similar.
Here are the numbers for 20-80% SOC:
| DC Fast Charging Comparison by InsideEVs | |||||
| Model [data source] | Drive / Battery (kWh) | Avg Power (20-80%) | EPA range rep. rate (20-80%) | EPA Hgw range rep. rate (20-80%) | IEVs 70mph range rep. rate (20-80%) |
| 2021 Tesla Tesla Model S Plaid (CCS1 adapter at EA) [Ryan Huber] | AWD 100 kWh | 140 kW | 13.8 km/min (8.6 mi/min) | 13.5 km/min (8.4 mi/min) | 11.9 km/min (7.4 mi/min) |
| 2021 Tesla Model S Plaid 21″ (V3 SC) [Tom Moloughney] | AWD 100 kWh | 139 kW | 13.7 km/min (8.5 mi/min) | 13.4 km/min (8.3 mi/min) | 11.8 km/min (7.3 mi/min) |
Conclusions
The main conclusion from the comparison of the V3 Supercharging test and the one-off CCS1 adapter test is that it’s technically possible to go above 200 kW with the adapter and that the charging curve should be very comparable after 35% SOC.
We don’t know whether the commercial Tesla CCS1 adapter will be able to deliver similar performance, but there is a potential (maybe the refreshed Model S/X will get such results at CCS2 natively in Europe).
Having an adapter like that would be a valuable addition in case a Tesla Supercharging station is full, or older type (lower power) or located less conveniently (driving time matters as well).
| 2021 Tesla Tesla Model S Plaid (CCS1 adapter at EA) :: DC Fast Charging Summary by InsideEVs Drive: AWD; Battery pack (net / total): 95 / 100 kWh [Data source: Ryan Huber] | |
| Peak Power Peak C-rate Average Power (20-80% SOC) Time (20-80% SOC) | 213 kW 2.1 140 kW 24 min |
| Range Replenishing Speed (Average 20-80% SOC): | |
| WLTP EPA Combined EPA Highway InsideEVs 70 mph | 15.5 km/min (9.6 mi/min) 13.8 km/min (8.6 mi/min) 13.5 km/min (8.4 mi/min) 11.9 km/min (7.4 mi/min) |
General info:
* Some values on the charts are estimated from the data source.
** Temperature of the battery cells might highly negatively affect charging capabilities. We don’t have data about temperatures of the battery at the beginning and during the charging process. In cold or hot weather, as well as after driving very dynamically, charging power might be significantly lower than shown on the charts (in extreme cases charging might be impossible until the battery temperature will not return to an acceptable level).
Source: Read Full Article


